I tackle complex concepts and make them easy to understand.

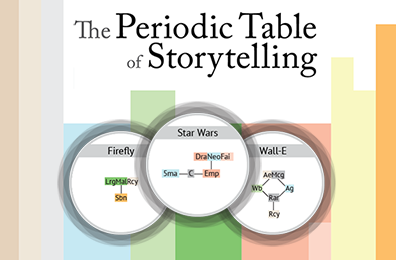
Stories make use of recurring ideas called "tropes" which repeat across genres and through time. The community at TVTropes.org catalogues these tropes in an enormous wiki, collecting examples for every imaginable trope with light-hearted glee. I created the Periodic Table of Storytelling as an introduction to TVTropes; it's an infographic that organizes the basic building blocks of storytelling into a familiar format.
Featured on Gizmodo, io9, The A.V. Club, Boing Boing, Laughing Squid, Fast Company, and Design Taxi, with over 2 million views.

Breaking problems into pieces that can be understood individually is a core tenet of software engineering. I wanted a to-do list that embodied this principle, but I couldn't find one that had all the features I wanted, so I built TaskFractal. It lets you break your work down into little pieces nested as deep as you want and helps you figure out what to work on next. Made with Ruby on Rails and React. See walkthrough
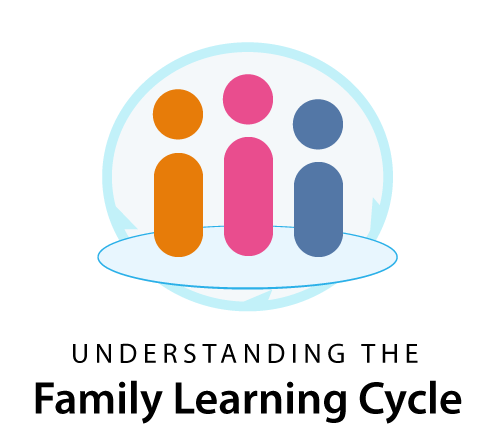
I worked for a homeschooling publisher with a sophisticated curriculum framework designed to allow parents to teach all their children at once rather than dividing them up by grade. This saved parents lots of time and money, but explaining how it worked was quite difficult. Every time they tried to write it out, the explanation turned into a wall of text, so they fell back on explaining it in person at conventions, which didn't scale well.
I realized I could probably solve this problem with an interactive infographic. After mocking it up in Illustrator, I built it out using HTML5 canvas and Fabric.js. I showed the prototype to our knowledgeable customer service reps, made changes based on their feedback, and published the project to our website.
After publication, I ran surveys to collect feedback about the project; 97% of our visitors indicated that this page helped them understand the Family Learning Cycle.
 james@jamesharris.design
 Blog
Blog
 GitHub